Introduction
The Innomesh Portal gives visibility over the entire environment, with rich visuals, an inbuilt Hotlist dashboard, Asset management and environment-wide Insights. This powerful tool gives the option to monitor the Infrastructure and network within your environment.
Pages
Hotlist
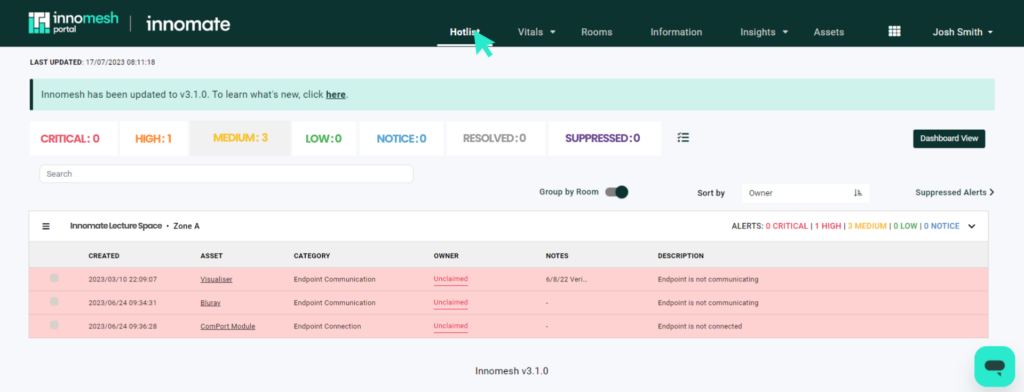
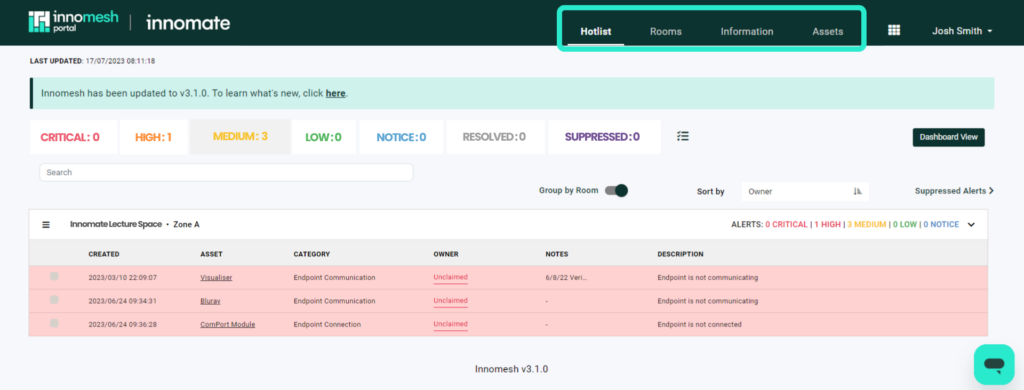
The Hotlist shows device and Infrastructure alerts are sorted into 6 categories, Critical, High Medium, Low, Resolved and Supressed. Alerts can be claimed and comments can be added. With an optional ServiceNow integration, ServiceNow tickets can be created.
Vitals
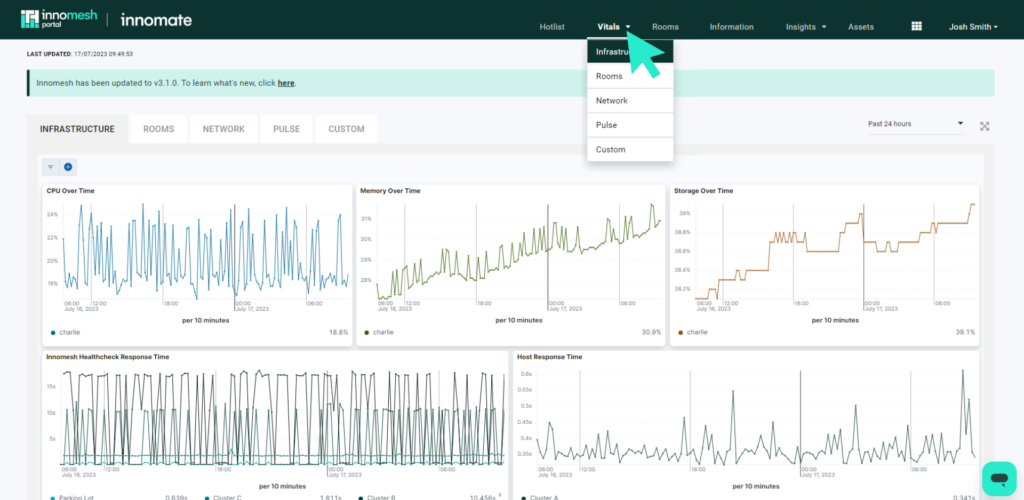
The Vitals page shows Infrastructure vitals, such as memory, CPU, storage over time, and health check response times.
Rooms
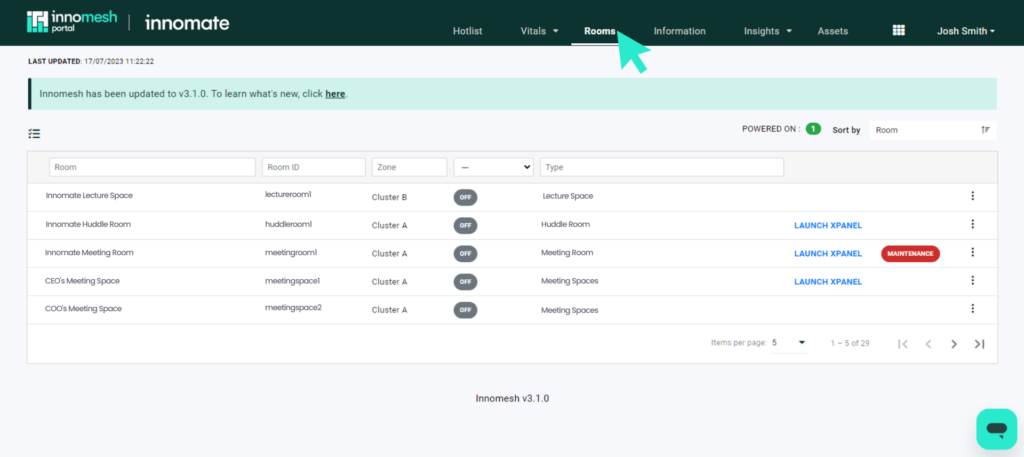
The Rooms page shows every room within the environment, with it’s On/Off status. If the rooms are SpaceVC or SpaceCE, there will be a hyperlink to the room’s XPanel or VNC.
Information
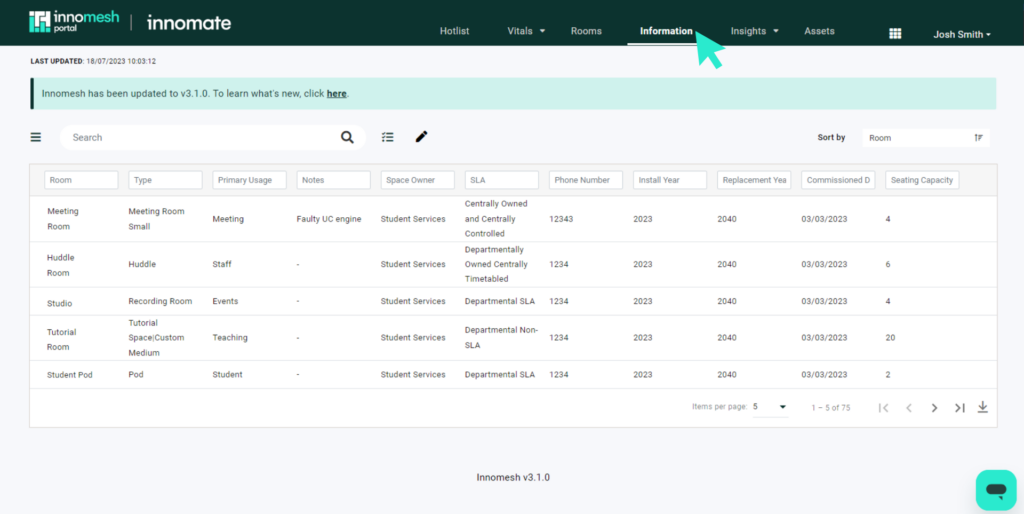
The Information page allows customised information within user-defined fields to be added to rooms. Files, hyperlinks and images can also be added as a requirement, so your organisation is never left without the information it needs.
Insights
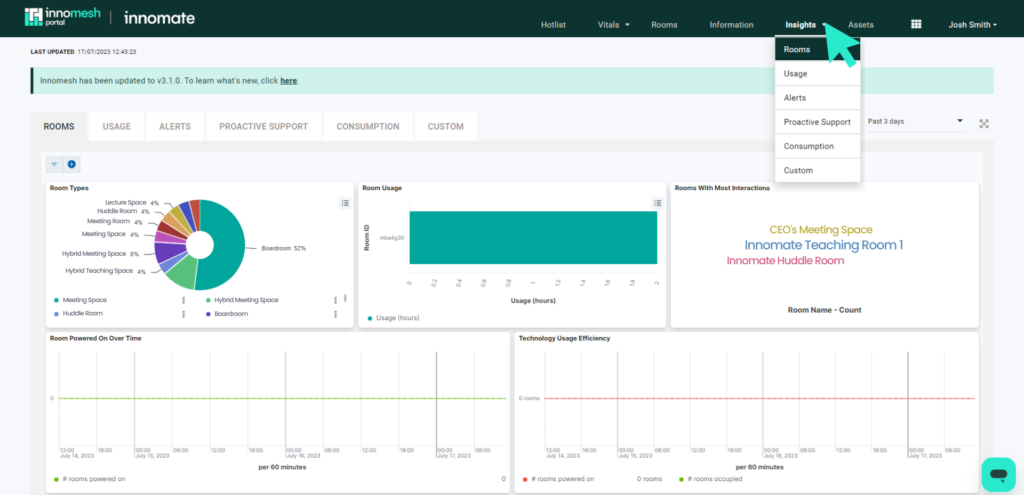
The Insights page shows metrics such as room usage, alerts over time, and total occupancy over time. It has a custom page, where graphs can be created and customised.
Assets
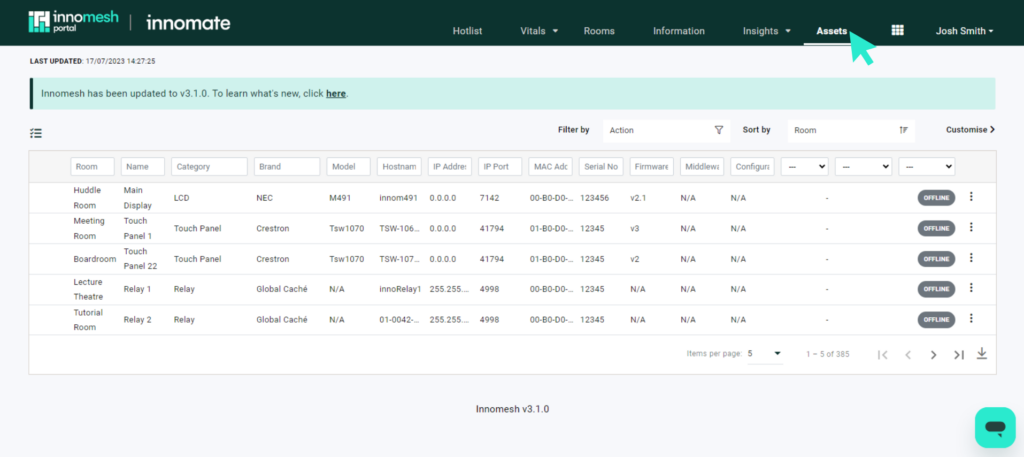
The Assets page shows all devices within the Innomesh environment. An optional Ops add-on gives targeted device controls, which allows rebooting, firmware upgrades, preset recalls and more.
Logging In
The Innomesh Portal is restricted to authorised users who must log in using their single sign-on (SSO) credentials. In most cases, Innomesh is integrated to your organisation’s SSO, and access is governed by your organisation’s Innomesh administrator.
Innomesh Portal provides two levels of user access:
Standard users are restricted to just the Hotlist, Rooms, Information and Assets pages.
Users are automatically logged out after a period of time. This is typically 4 hours, but can depend on your organisation’s security policies.
