Innomesh v3.4.1 was released to production on 24/05/2024. Here’s a summary of the new features, enhancements and bug fixes in this release.
What’s New – June 2024
What’s New in Innomesh Portal:
Room Support View – your single pane of glass view of a room, showing you a dashboard style view of a room’s key information, providing a simple, powerful way for support teams to quickly understand all aspects of a room, and take effective action.
Room Operations – a sub-feature of Room Support View, which allows you to trigger any of the room/s available actions, in an easy to find location within your Room Support View.
Q-Sys Interoperability – We did it! Now available in selected tenancies, this incredibly powerful new feature allows you to view and search all logs, events, insights and files from Q-Sys devices, allowing for rapid diagnosis and actions relating to your environment. This feature has enabled a broad range of Q-Sys related insights and actions, including:
- Global Events
- Global Vitals
- Q-Sys Centric Alerts in Hotlist
- Q-Sys Core Ops
- Q-Sys Peripherals
Q-Sys Notifications (Via Live Messaging) – We have also enabled live messaging notifications for Q-Sys events. Q-Sys events will also be recorded for auditing. Q-Sys events will trigger notifications within your organisation’s integrated messaging platform, i.e.Slack or Microsoft Teams. Your support team will now receive live messaging notifications for the following:
- BMCA Master Clock Changes
- PTPPv1 and PTPv2 Changes
- Q-Sys Server Configuration Changes
- Q-Sys Server Authentication Attempts (failed and successful – for security reasons)
- Q-Sys Server Vital Metrics (CPU, Memory, Temperature etc.)
Q-Sys Interoperability has enabled many more powerful features for you within Innomesh, so make sure you take a look at the detailed overview in the Q-Sys Interoperability section of this release.
Metrics Dashboard (Sight and Ops) – We’ve added more data visualisations to the “Vitals” and “Insights” dashboards, including CPU and Memory data, queries processed, errors logged, and query response times.
Additional Hotlist Alerts – you will now see alerts in your Hotlist if Sight fails to connect to and/or authenticate with devices.
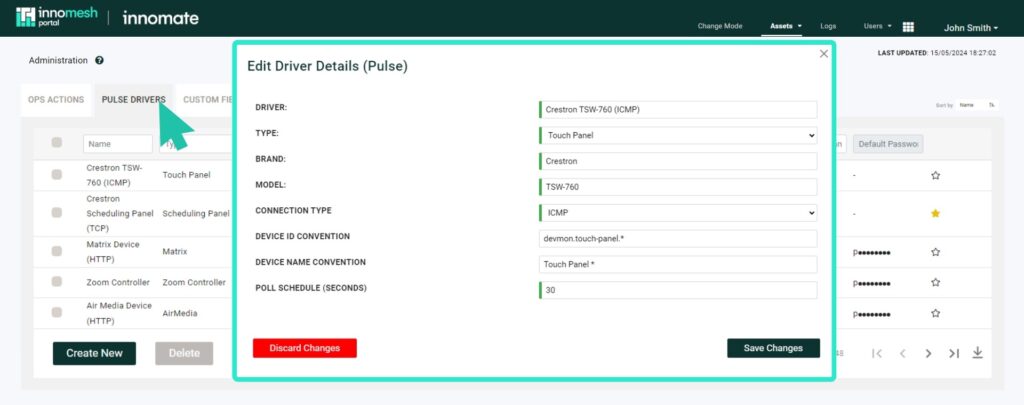
Driver Manageability – Innomesh Portal admins can now manage Pulse drivers from the Innomesh Portal administration section.
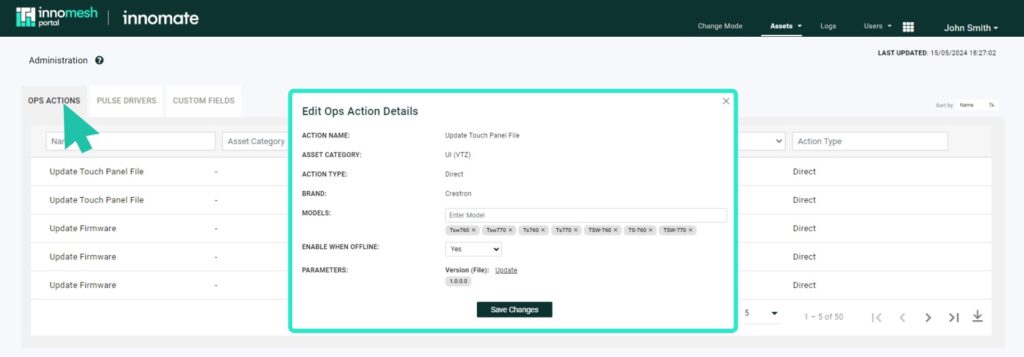
Actions Manageability (Ops) – Innomesh Portal admins can now upload files and manage actions (i.e. updating touch panel UI files, updating device firmware).
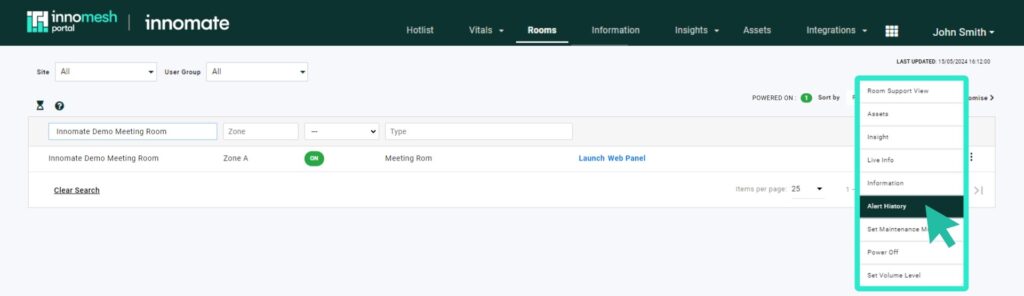
Alert History for All Rooms – You can now easily access alert history for rooms, enabling the ability to quickly review a complete record of all alerts associated with a specific room.
Room Level CPU Alerts – We’ve added room level CPU alerts to the Hotlist, with a medium severity alert being triggered at 6% utilisation, and a high severity alert triggered at 12% utilisation, to enable clear identification of any high CPU usage in a room.
Host CPU Alerts – We’ve updated Host CPU alerts to now have a 2 minute threshold, to prevent one-off spikes from triggering a critical alert.
What’s New in Innomesh Room Manager:
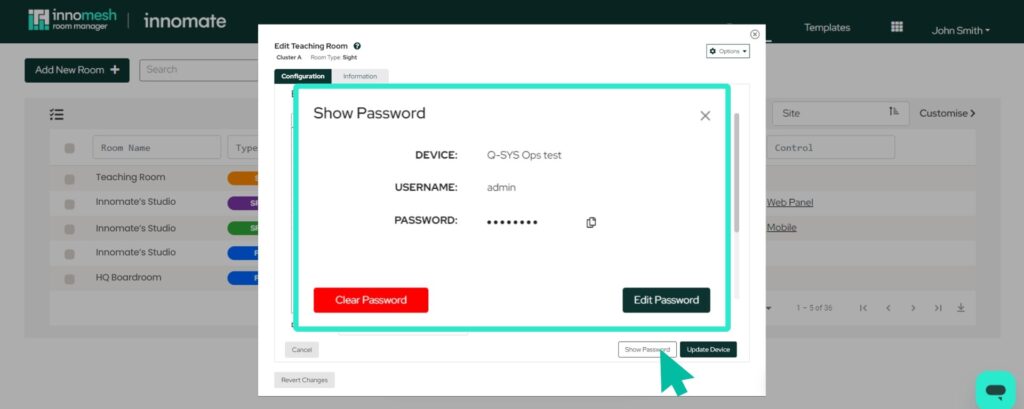
Password Management (Sight) – You can now manage passwords for devices directly within the room’s configuration section in Room Manager.
Mass Upgrade/Downgrade (Pulse/Sight) – You can now perform mass upgrades from Pulse to Sight, and mass downgrades from Sight to Pulse within Room Manager.
Launch an XPanel or Web Panel – You can now launch an XPanel, VNC, or Web Panel within the room configuration interface from the Options menu, making room updates and integrations more efficient.
Hot Reload (VC-4 Gateway) – You can now perform a hot reload on the VC-4 Gateway, to update new devices without disconnecting existing devices. This is now the default option, but you can still action a conventional update via the dropdown menu.
What’s New – The Details
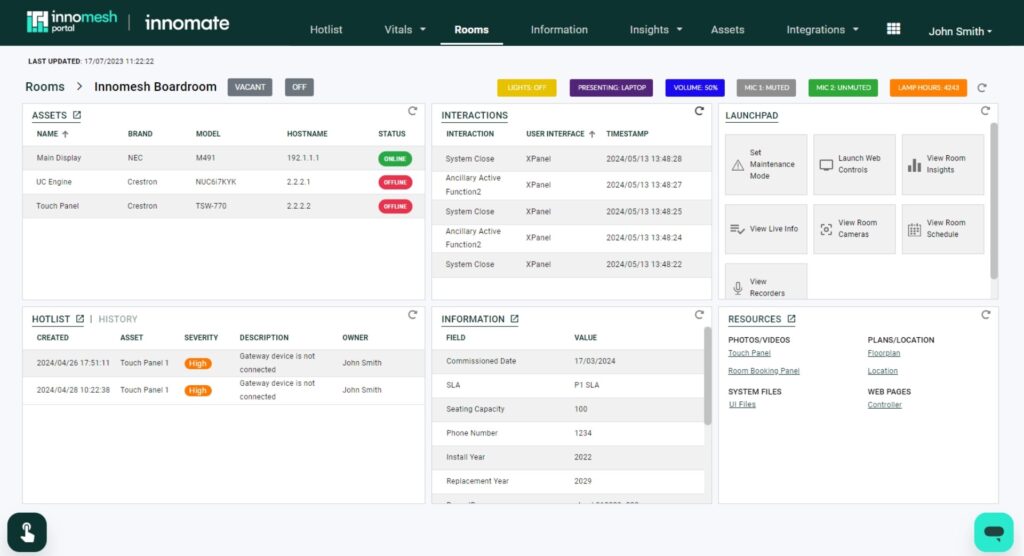
Room Support View
First up, welcome to our latest feature, Room Support View
This “single pane of glass” provides a dashboard style overview of a room’s key information, providing a simple, powerful way for support teams to quickly understand all aspects of a room, and take effective action. Room Support view includes the room’s alerts and alert history, room assets, resources like room imagery, floorplans, the room’s location, and much, much more. Room Support View enhances operational efficiency when supporting a room, or when maintenance is required, and is a simple and effective source for gathering information.
Here’s an example of Room Support View:
To access a room’s Room Support View, click on any room in the Rooms tab; alternatively, hover over the room’s menu and click on “Room Support View“.
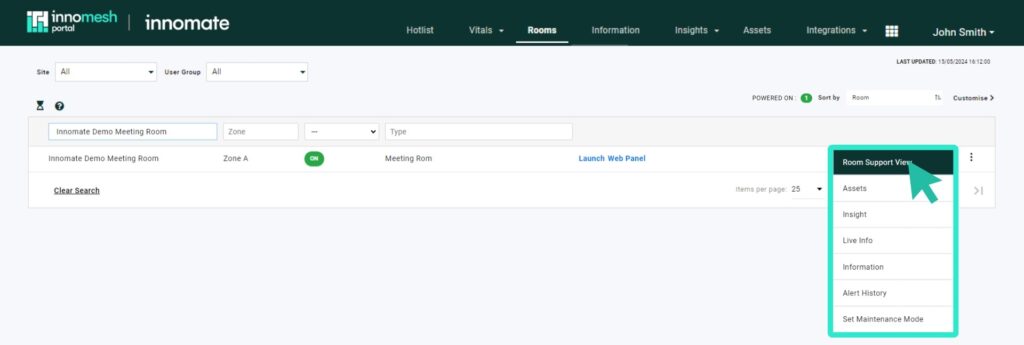
The Room Support View includes the following elements:
- Assets – This will display all configured assets for the associated room.
- Interactions – A view of all user interactions through the room’s touch panel/s or keypad.
- Launchpad – This provides quick access options for common room functions, including:
- Maintenance Mode: This allows the user to put a room into and out of Maintenance Mode.
- View Room Insights: Takes you to the room’s Insights page.
- View Live Info: This shows the room’s Live Info page.
- View Room Camera: Where available, this accesses the room’s camera. Functionally, the platform searches for and accesses the Information Portal hyperlink using the keyword “camera”, if one exists.
- View Room Schedule: Where available, this accesses the room’s schedule. Functionally, the platform searches for and accesses the Information Portal hyperlink using the keyword “timetable”, if one exists.
- Launch Web Controls: Where available, this launches either the room’s Web Panel or XPanel.
- Hotlist/History – This provides you with a view of the room’s current alerts, and its alert history.
- Information – This displays the room’s Static Information.
- Resources – This displays the resources (files and hyperlinks) from the room’s Static Information.
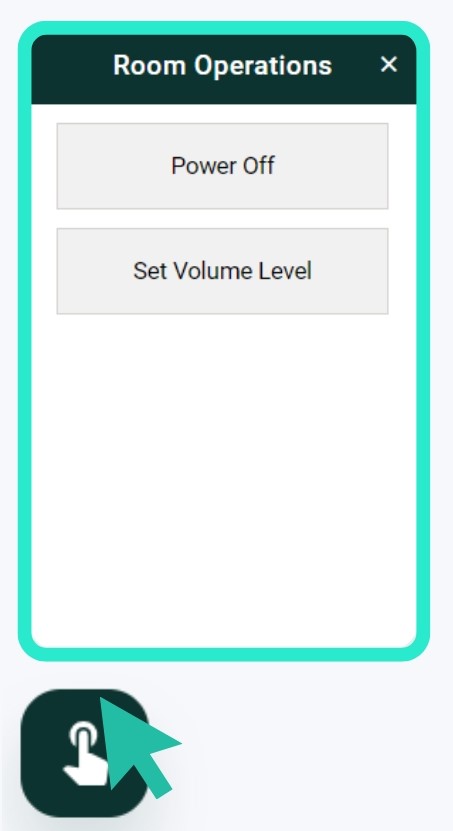
Room Operations
A new sub-feature of Room Support View, “Room Operations” allows you to trigger any of the room’s available Ops actions.
You can access the Room Operations pane by clicking the icon displayed in the bottom left corner of your screen, as shown below:
Q-Sys Interoperability
Previously, a significant gap existed across environments with Q-Sys integrations, due to a lack of access to data across the Q-Sys ecosystem. This translated to a number of critical challenges for an AV environment in terms of availability, reporting, functionality, automation and observability constraints. With no notifications for server faults, complex manual troubleshooting processes, no tracking of Q-Sys server metrics, no central alerting, no historical audit trail or event visibility, and no automated configuration management on the Q-Sys servers, AV environments were being restricted and constrained, impacting service quality, and operating costs.
Now, with Innomesh, we’ve plugged that gap! With our rich integration to the Q-Sys ecosystem, the Innomesh platform now provides true Q-Sys Interoperability across your environment, and enables a broad range of powerful functions and features.
In the video below Neil Collins, Innomate’s Director of Growth, interviews Innomate CEO, Paul Yahchouchy, about how this initiative came about, the significant investment in building a feature of this magnitude, and the benefits to Innomesh customers.
Q-Sys Interoperability can be accessed through a new “Integrations” menu within Innomesh Portal, as well as through the Innomesh Portal Assets Registry. The Q-Sys integration feature allows you to view and search all logs, events, insights and files gathered from Q-Sys devices, ensuring that widespread Q-Sys outages can be diagnosed and addressed rapidly.
Let’s take a look at some of the key features unlocked through Innomesh’s exciting new platform feature release: Q-Sys Interoperability
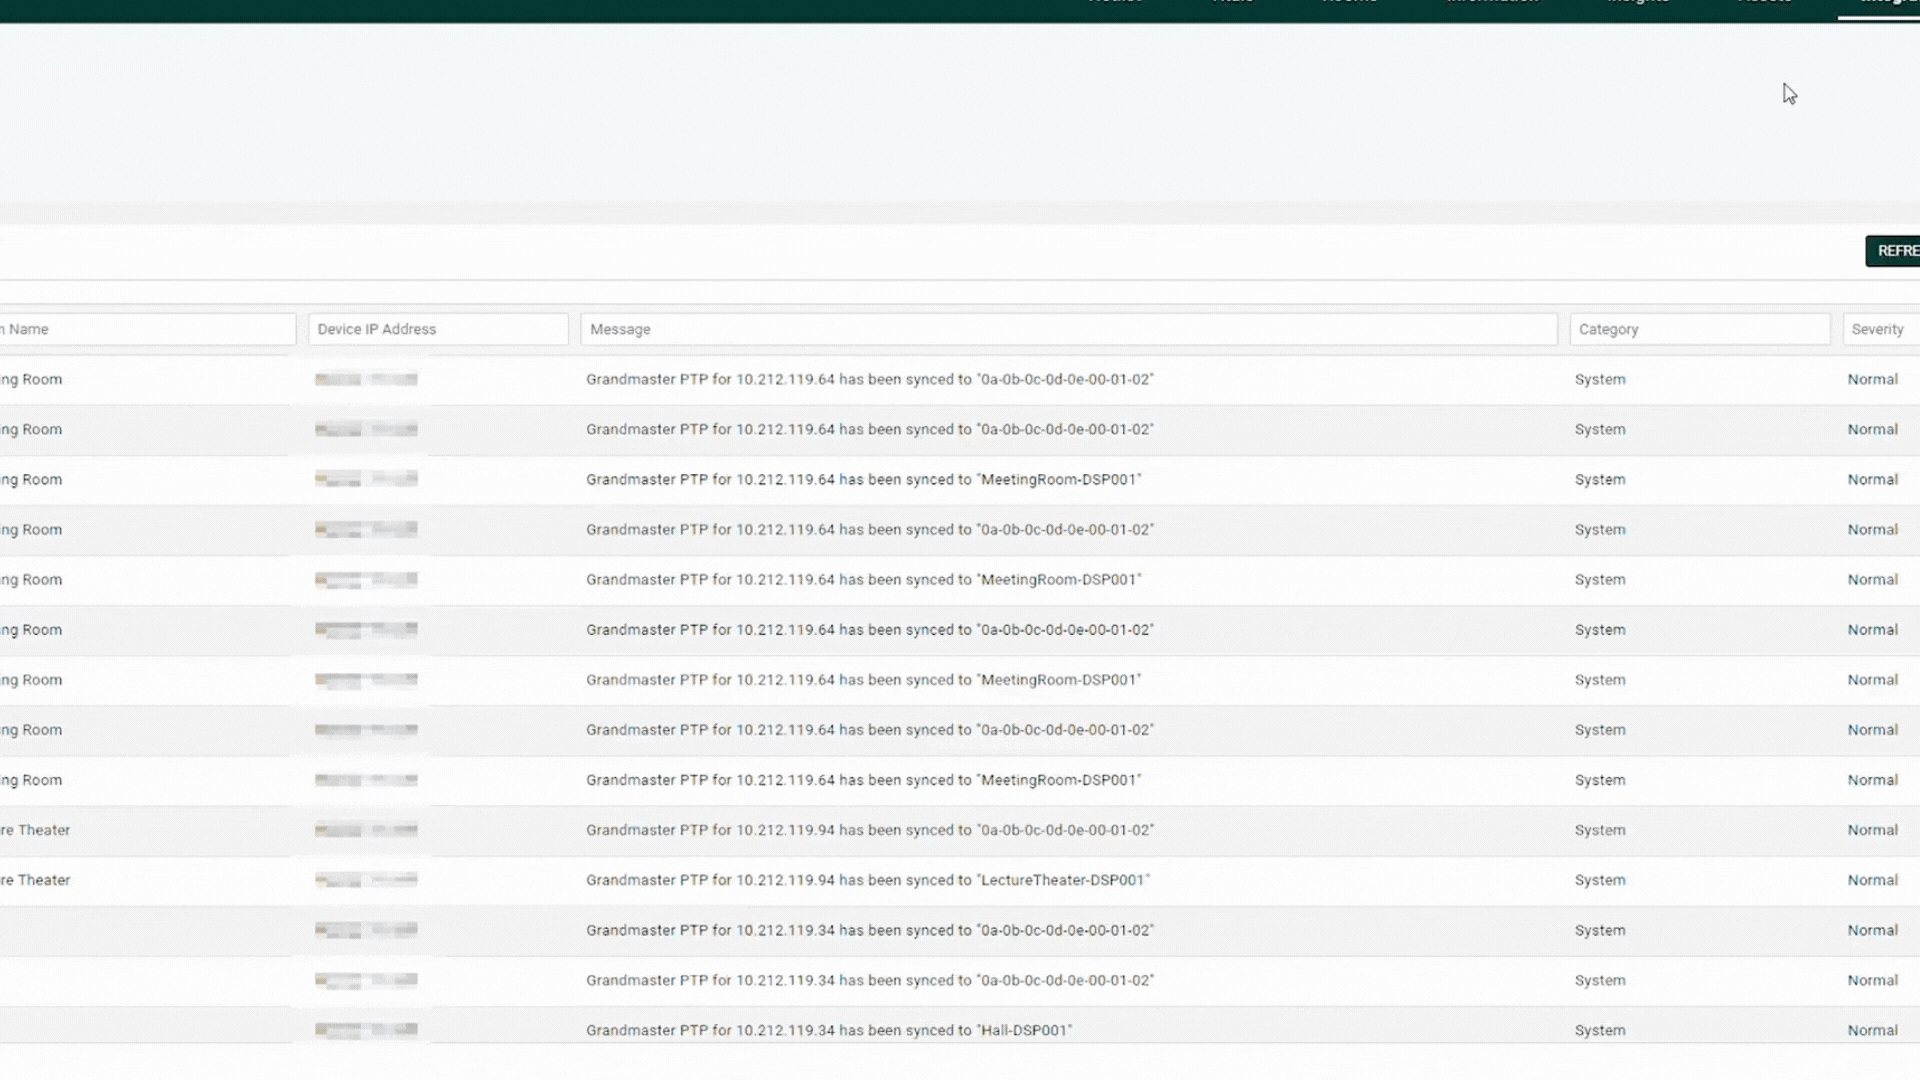
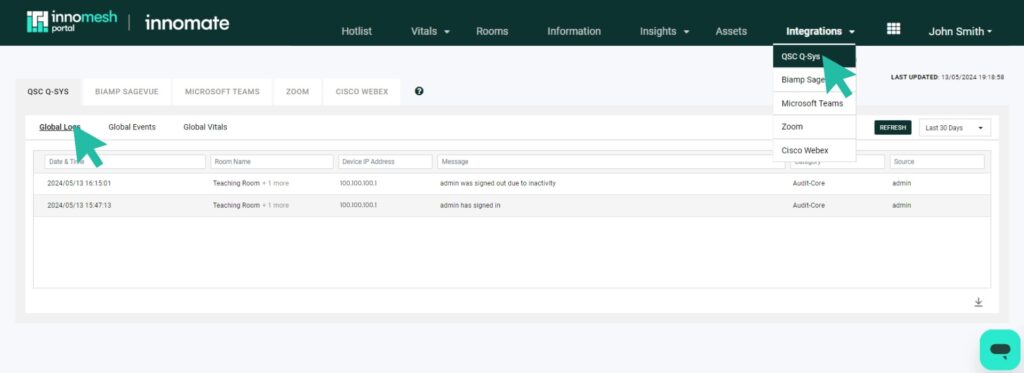
Q-Sys Global Logs
This view shows the results the logs pulled from every Q-Sys core within your AV environment, and allows you to filter and analyse all logs from all devices in one view. You will now have advanced querying and filtering capabilities across Q-Sys logs for your entire environment, enabling much faster troubleshooting.You also now have up to a minimum of three month logging capacity, and a current maximum of 365 days, which enables historical troubleshooting of metrics and events, providing a robust audit trail.
Q-Sys Global Events
This view displays all events that have been detected across all Q-Sys cores across your AV environment. All Q-Sys events will also now trigger a live messaging alert for your support team via your organisation’s live messaging platform, i.e. Slack or Microsoft Teams.
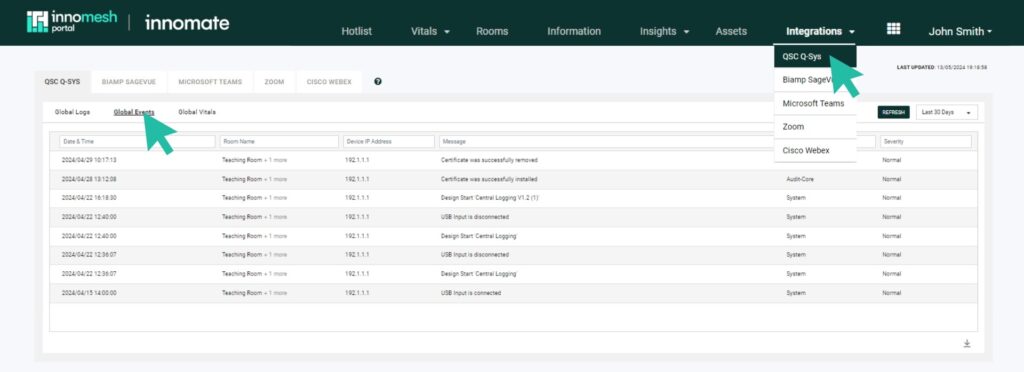
Events that are detected include:
- DSP Design Status – shows the initiation of a system, observable after a firmware update or power reboot. It will be displayed as ‘Design Start [File Name]’.
- Grandmaster Clock Change – indicates any changes in a Q-Sys core’s Grandmaster clock.
- PTPv2 Offset Change – provides updates to changes in the PTPv2 offset.
- USB Connection Status – indicates the connection or disconnection of any USB inputs. These events will be displayed as ‘USB Input is Disconnected’ or ‘USB Input is Connected’.
- Certificate Update – shows any updates to the certificate installed on the device, such as certificate installation or removal. These events will be displayed as ‘Certificate was successfully installed’ or ‘Certificate was successfully removed’.
Q-Sys Notifications (Via Live Messaging)
We have also enabled live messaging notifications for Q-Sys events. Q-Sys events will also be recorded for auditing. Q-Sys events will trigger notifications within your organisation’s integrated messaging platform, i.e.Slack or Microsoft Teams. Your support team will now receive live messaging notifications for the following:
- BMCA Master Clock Changes
- PTPPv1 and PTPv2 Changes
- Q-Sys Server Configuration Changes
- Q-Sys Server Authentication Attempts (failed and successful – for security reasons)
- Q-Sys Server Vital Metrics (CPU, Memory, Temperature etc.)
Q-Sys Interoperability also enables automated live analysis, including automated fault detection, which is based on defined data trends, such as PTP and BMCA conflicts. The below example shows a visualisation of data gathered from all Q-Sys devices across your environment.
Q-Sys Global Vitals
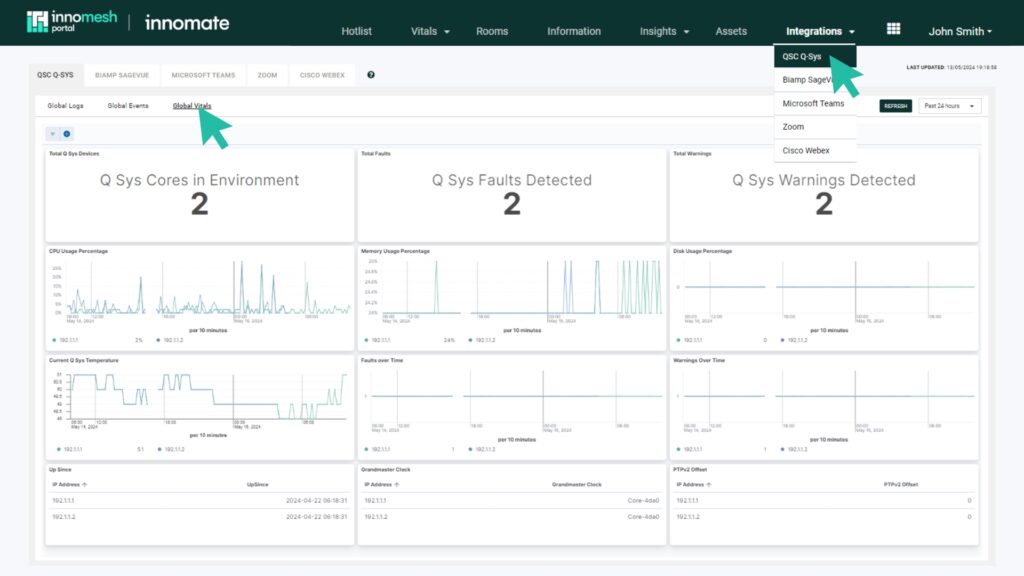
- Total Q-Sys Devices – displays the number of Q-Sys Core units enabled in your environment.
- Total Faults – displays the number of faults per Q-Sys Core unit. These faults will also appear in the Hotlist.
- Total Warnings – displays the number of warnings per Q-Sys Core unit. These warnings will also appear in the Hotlist.
- CPU Usage – shows the CPU usage of the Q-Sys units as a percentage. Abnormal CPU usage will trigger an alert in the Hotlist.
- Memory Usage – shows the memory usage of the Q-Sys units as a percentage. Abnormal memory usage will trigger an alert in the Hotlist.
- Disk Usage – shows the disk usage of the Q-Sys units as a percentage. Abnormal disk usage will trigger an alert in the Hotlist.
- Core Temperature – shows the temperature of the Q-Sys units in Celsius. High temperatures will trigger an alert in the Hotlist.
- Up Since – indicates the uptime of the Q-Sys units since the last power-off or network drop.
- Grandmaster Clock – displays the grandmaster clock for each Q-Sys device.
- PTPv2 Offset – shows the offset for each Q-Sys device.
Q-Sys Centric Alerts in Hotlist
You will now see all Q-Sys centric alerts related to Q-Sys cores and their peripherals included in the Hotlist.
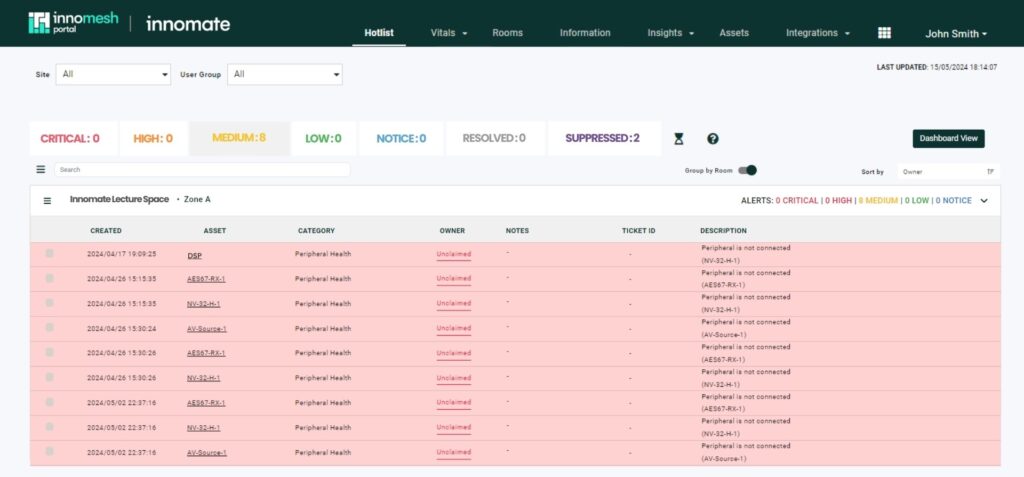
The Q-Sys centric alerts that are now included in the Hotlist are listed below:
- Peripheral health
- Grandmaster clock faults
- Core overheating
- High CPU usage
- High memory usage
- High storage usage
Q-Sys Core Ops
This feature allows you to trigger Ops actions specific to Q-Sys from the Innomesh Portal Assets Registry, just as you are used to doing for all other Ops actions.
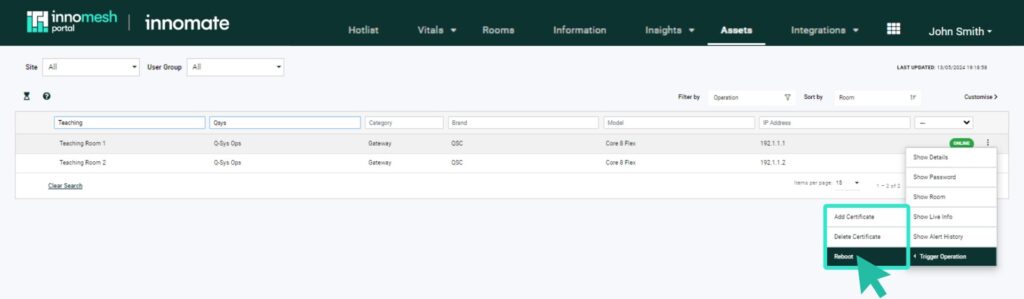
This means you now have the following additional Ops actions, specific to Q-Sys:
- The ability to reboot
- The ability to upload or delete certificates
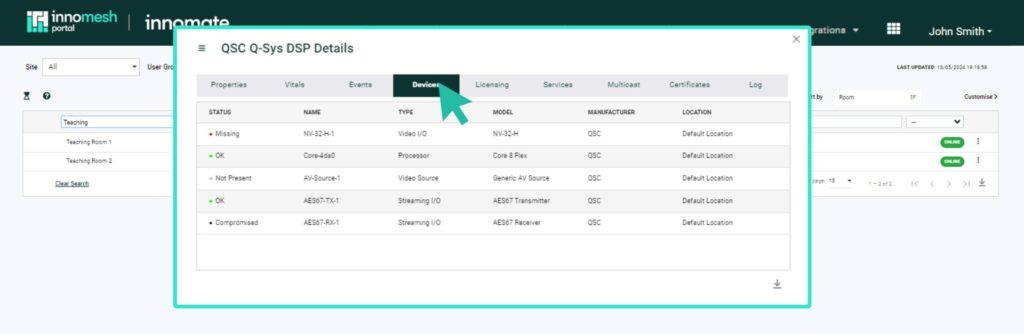
Q-Sys Peripherals
Q-Sys peripherals, gathered using Q-Sys device information, are now included as part of the Innomesh Portal Asset Registry.
Automated Configuration Management
Through Q-Sys Interoperability in Innomesh, your Q-Sys server configurations will now be regularly archived and versioned into a repository, without human intervention.
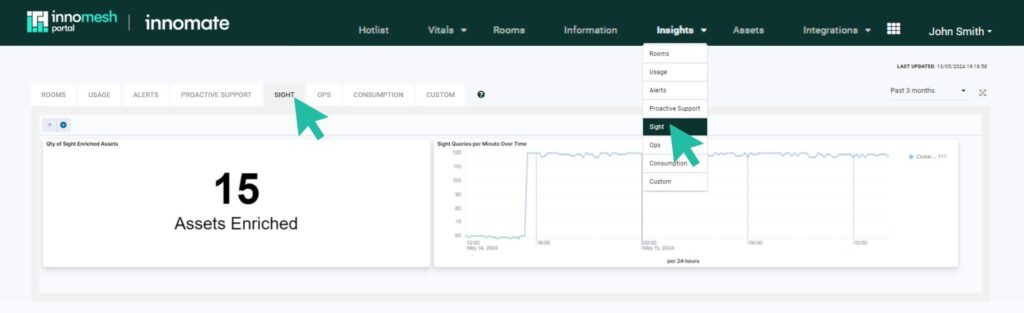
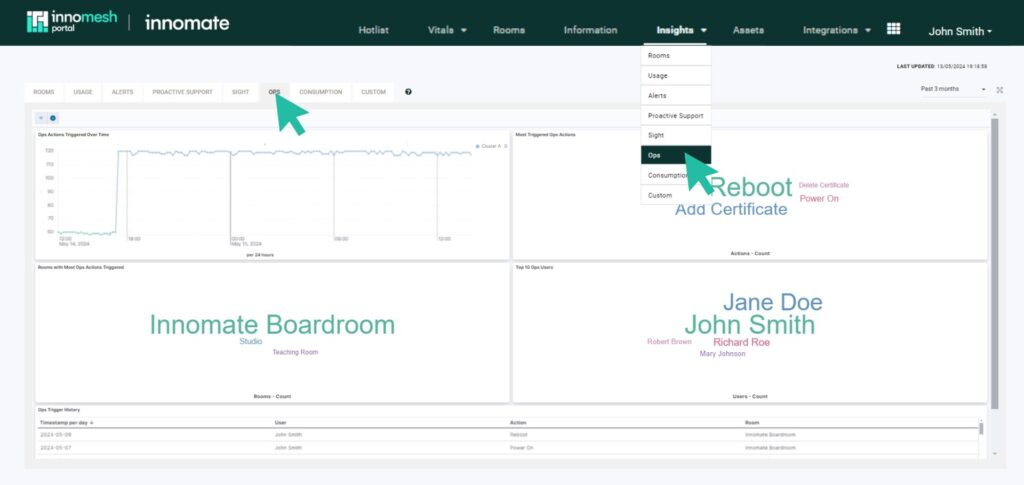
Metrics Dashboard (Sight and Ops)
The observability metrics for Sight and Ops have now been enhanced to now include:
- New Sight and Ops vitals and insights dashboards showing CPU and memory vitals, queries processed, errors logged, and query response times
- Innomesh Portal Hotlist Alerts for when Sight fails to connect to and authenticate to devices
Additional Hotlist Alerts
You will now see alerts in your Hotlist if Sight fails to connect to and/or authenticate with devices.
As covered earlier, you will now also see Q-Sys related alerts in your Hotlist.
Room-level CPU Alerts have been added to Hotlist, with a medium severity alert at 6% utilisation, and a high severity alert at 12% utilisation. This ensures that users can identify the cause of high CPU usage by the room.
Driver Manageability (Pulse)
Innomesh Portal Administrators can now manage Pulse drivers directly from the Innomesh Portal administration page.
Actions Manageability (Ops)
Innomesh Portal Administrators now have the capability to upload files and manage actions for Ops directly through Innomesh.
Alert History for All Rooms
You can now access alert history for rooms, providing you with the capability to review the complete record of alerts associated to a specific room.
Room-Level CPU Alerts
As covered in “Additional Hotlist Alerts“, Room-level CPU Alerts have now been added to Hotlist, with a medium severity alert at 6% utilisation, and a high severity alert at 12% utilisation. This ensures that users can identify the cause of high CPU usage by the room.
Host CPU Alerts
Host CPU alerts have been updated with a 2-minute threshold to prevent one-off spikes from triggering critical alerts.
Password Management (Sight)
You can now manage passwords for Sight-configured devices.
Mass Upgrade/Downgrade (Pulse/Sight)
You can now efficiently perform mass upgrades from Pulse to Sight, and Mass downgrades from Sight to Pulse.
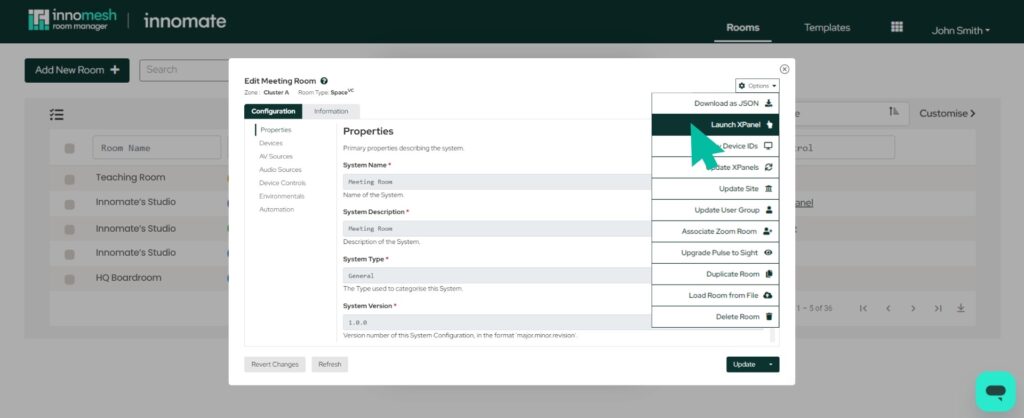
Launch XPanel or Web Panel
In the Room Manager‘s configuration interface, you now have the ability to launch an XPanel, VNC, or a Web Panel directly from the ‘Options‘ menu. This streamlines the process of updating and integrating a room.
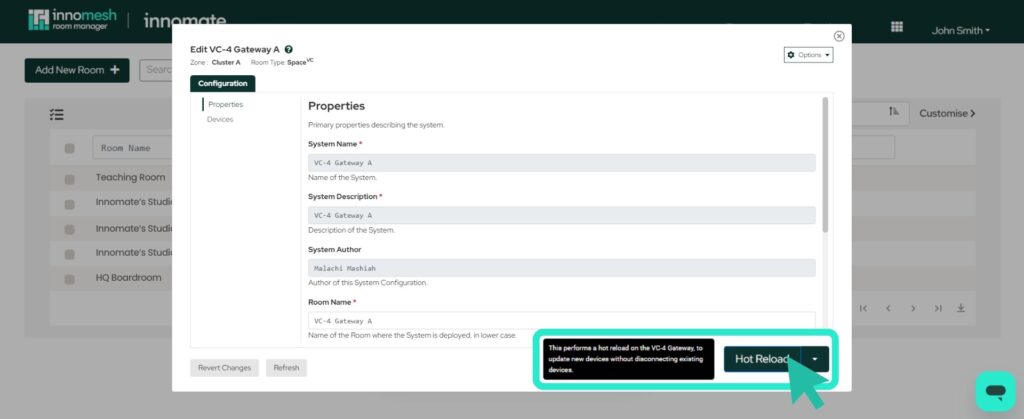
Hot Reload (VC-4 Gateway)
You can now perform a hot reload on the VC-4 Gateway, to update new devices without disconnecting existing devices. This is now the default option, but you can still action a conventional update via the dropdown menu.

Bug Fixes
- Sight rooms are now “Site” aware. This fixes an integrity issue with the display of rooms within the Innomesh Portal Room Registry.
- A bug has been fixed for Asset Live Information that can result in certain Live Information fields not showing.
- An issue with VC-4 Gateway Hot Reload resulting in an unintended full restart of the VC-4 Gateway has been resolved.
- An issue with the Hotlist Dashboard’s “return” workflow not working has been rectified.
- For both Innomesh Room Manager and Portal, an issue with the user logout flow that logs the user straight back in after logging out has been remediated.
- A bug in the Information Portal where a search field, if entered before the page has completed loading, will appear erroneously in the “Room” filter has been fixed.
- Within the Innomesh Portal Assets Registry, a bug has been fixed when editing asset fields, where clicking outside the edit window will closes the window unexpectedly, resulting in loss of all unsaved changes.
- Innomesh Portal Hotlist errors resulting from the race condition of a user update to an alert (e.g. claiming the alert) happening concurrently to the alert being automatically resolved is now handled gracefully.
- In Room Manager, room and system template IDs (or “repository names”) will now warn the user when the entered ID length exceeds the allowable limit (between 52 and 62 characters, depending on the room type).