1 Navigation Bar
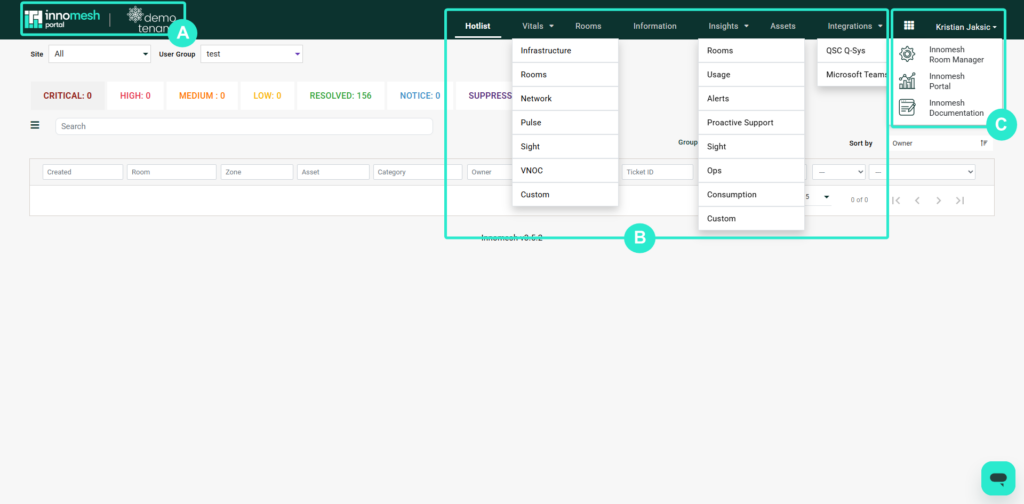
A. Logo
Innomesh and client logos. Clicking on these logos will bring you to the Hotlist.
B. Top navigation bar
The top navigation bar allows users to move between the Hotlist, Vitals, Rooms, Insights, Information and Assets pages. The home screen of the Portal page is the Hotlist by default.
For more information on these pages, visit the following links:
- For the Hotlist overview, click here.
- For the Vitals overview, click here.
- For the Rooms overview, click here.
- For the Insights overview, click here.
- For the Assets overview, click here.
C. Platform navigation menu
Users can use the 9-dots navigation menu to access different parts of the Innomesh platform, namely the Innomesh Room Manager, Innomesh Portal, and Innomesh Documentation.
Hotlist
The Hotlist shows all alerts in a given environment. These alerts are sorted into separate categories, depending on severity.
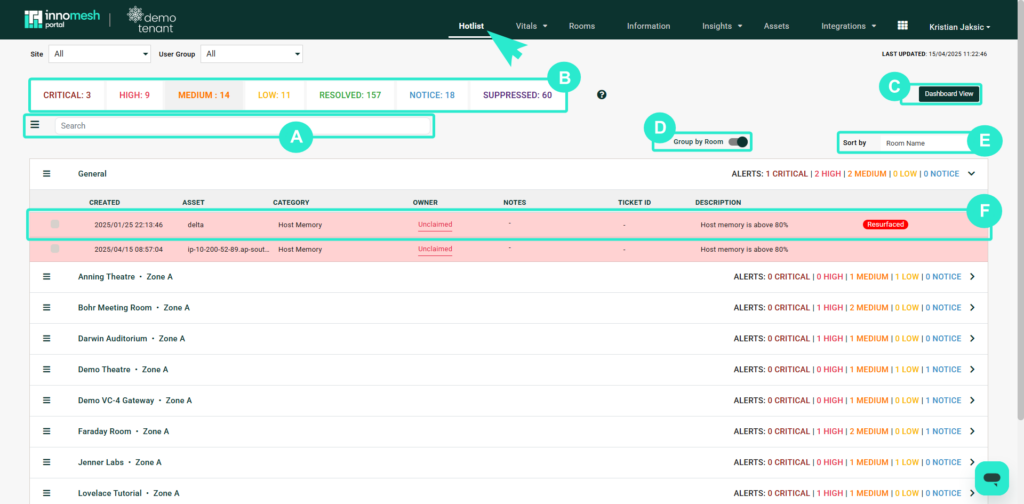
A. Alarm search bar
Specifics of alarms can be searched using this search bar. Searchable fields are listed in point I below.
B. Alarm severities
Alerts are separated into 6 different categories: Critical, High, Medium, Low, Notice, Resolved and Suppressed. To navigate between these alerts categories simply click on the category name.
For more information about alerts and their categories, view this article.
C. Dashboard view
The Dashboard View button creates a widescreen view of the Hotlist, with all alerts shown at once. This view may be desirable in an AV or IT office or control room with multiple displays.
D. Group by room
This option is automatically selected, and groups alerts by room. Unselecting this value shows alerts in a list view. Each of the fields shown above the alerts can be used to narrow the list down using the search bar (point E), and the download button can download this list as a CSV file.
E. Sort By Filter
The Sort By filter allows a hierarchy of ascending and descending orders to be placed upon the list of alerts. This list can be sorted in ascending/descending order of multiple fields at once.
F. Alerts
Alerts are shown here, each alert consists of the following fields:
Description – a brief description of the alert.
Created – the time and date when the alert was created.
Asset – the ‘Friendly Name’ of the device which the alert is associated with.
Category – the category of the alert, such as an endpoint communication error or a battery error.
Owner – each alert can be claimed by an owner. This owner can add comments to the alert, such as RMA details or notes on why the device may be failing.
Ticket ID – with the ServiceNow integration add-on, alerts in the Hotlist can be used to create ServiceNow tickets. For more information, click here.
Vitals
The Vitals page shows the vitals of the entire Innomesh ecosystem, including the infrastructure, rooms, network and so on.
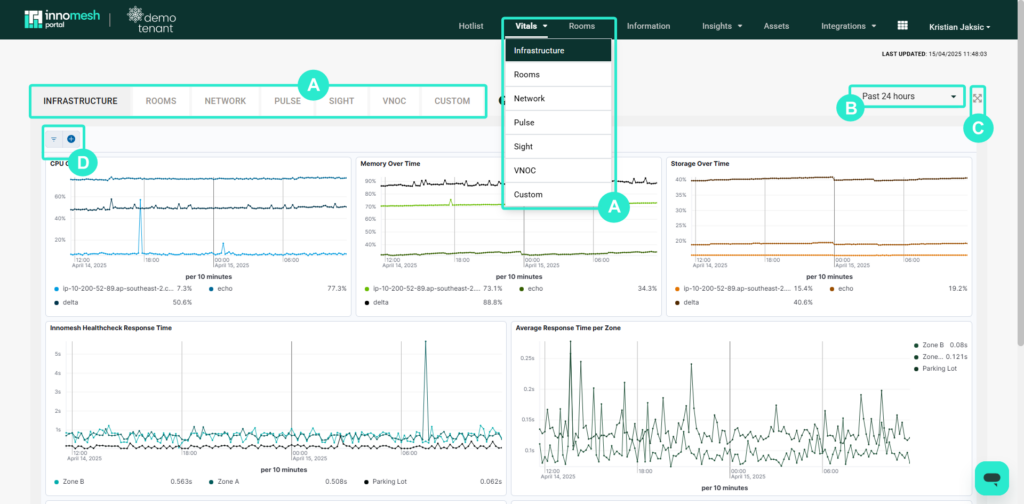
A. Navigation bar
Users can move through the different Vitals categories either through a dropdown menu on the top navigation bar or by clicking through the categories on the top left of the page.
B. Vitals period
The time period in which the vitals are displayed can be adjusted, with several values between 30 minutes and the past 7 days.
C. Fullscreen
This button allows Fullscreen mode, which is ideal for displaying in an AV or IT operations office.
D. Custom filter/query
Custom filters and queries can be added on top of the default vitals page.
E. Vital specific controls
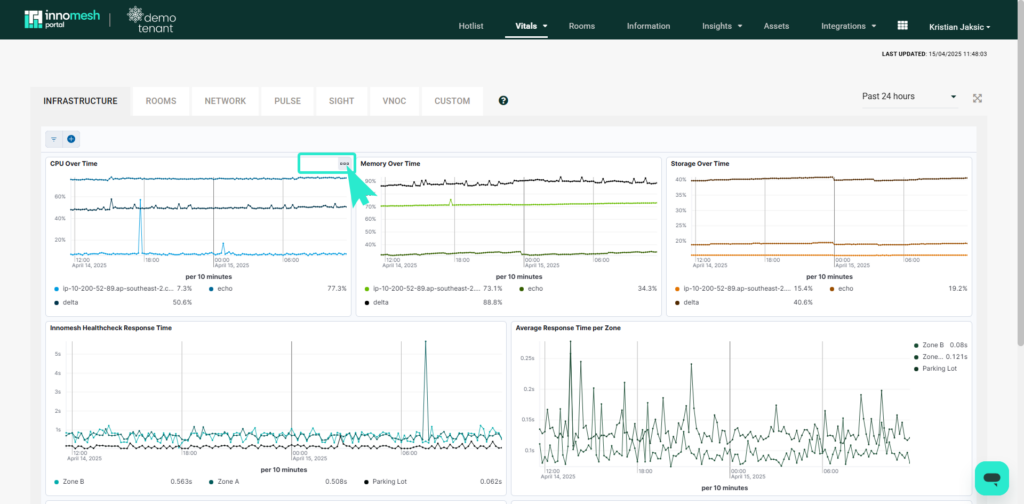
Individual vitals can be adjusted here, time ranges customised, graphs maximised, and the API calls to the Elastic search can be inspected.
Rooms
The rooms page shows every room within your tenancy.
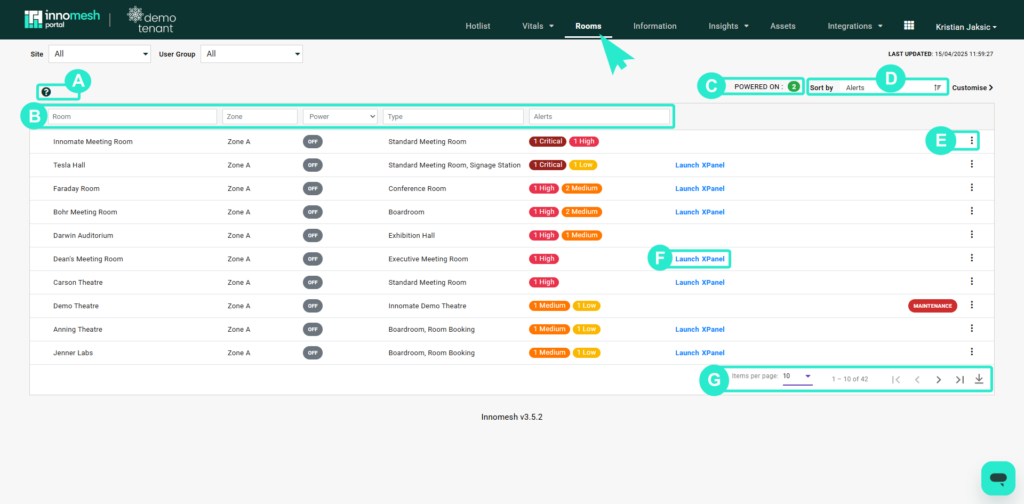
A. Info Icon
Clicking on the question mark icon provides helpful intel and information about the current page and its functionalities. It serves as a quick reference guide to better understand the tools, options, and features available within that section.
B. Searchable fields
A room consists of the following fields:
- Room – ‘Friendly Name’ associated with the room, created in Innomesh Room Manager platform.
- Room ID – a unique ID for identifying a room
- Zone – the Virtual Machine which stores the room configuration.
- Power value – this value is either on or off, at any given time.
- Type – the ‘Friendly Name’ for the system template.
- Alert – allows you to search for “alert type”.
C. Rooms powered on
This icon shows the total rooms powered on within your Innomesh tenancy.
D. Sort by filter
The Sort By filter allows a hierarchy of ascending and descending orders to be placed upon the list of alerts. This list can be sorted in ascending/descending order of multiple fields at once.
E. Enhanced Room navigation
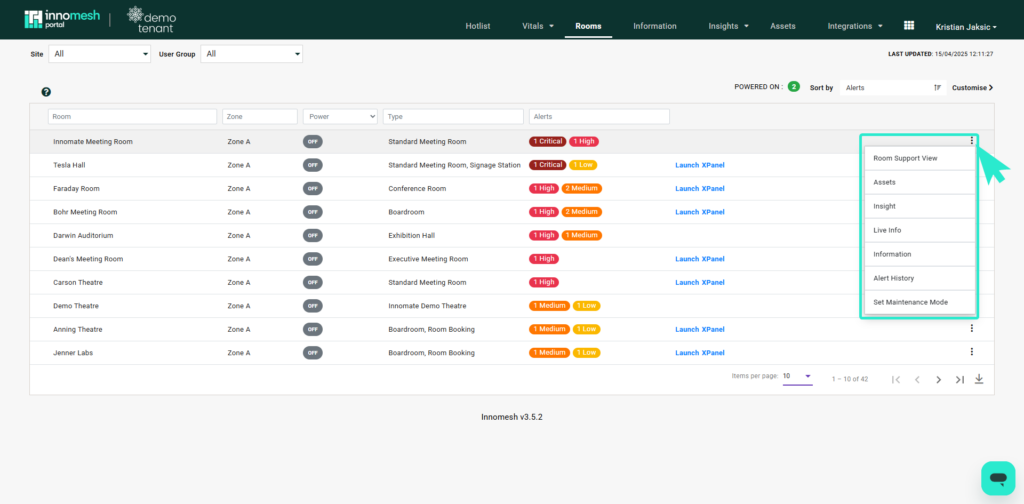
The ellipses next to each room allow the user to quickly navigate to the Assets, Insight and Live Info pages associated with that given room.
F. Launch XPanel
For Crestron rooms with a touch panel interface, an XPanel, which is a virtualised user interface mirroring the actual touch panel interface, can generally be launched by clicking this link.
G. Navigation section
This section allows navigation between the pages of rooms. Each page can show between 15 and 100 rooms.
Insights
The Insights page, is much like the Vitals page shown earlier in this article. Valuable insights are provided in multiple formats which can help notify Business managers and Analysts on how the systems are being used within an environment.
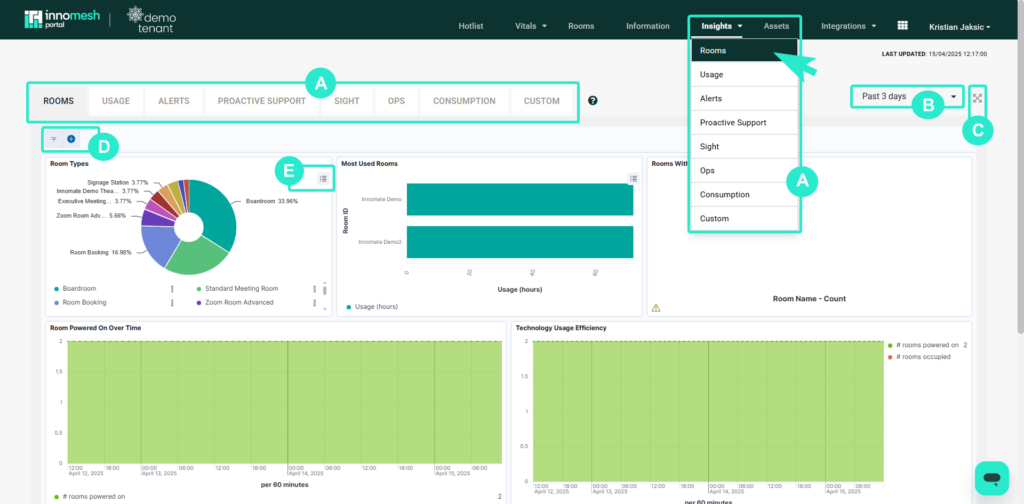
A. Navigation bar
Users can move through the different Insights categories either through a dropdown menu on the top navigation bar or by clicking through the categories on the top left of the page.
B. Insights period
The time period in which the vitals are displayed can be adjusted, with several values between 30 minutes and the past 7 days.
C. Fullscreen
This button allows Fullscreen mode, which is ideal for displaying in an AV or IT operations office.
D. Custom filter/query
Custom filters and queries can be added on top of the default vitals page.
E. Insight specific controls
Individual vitals can be adjusted here, time ranges customised, graphs maximised, and the filters can be inspected.
Assets
The Assets page shows all devices within the Innomesh environment.
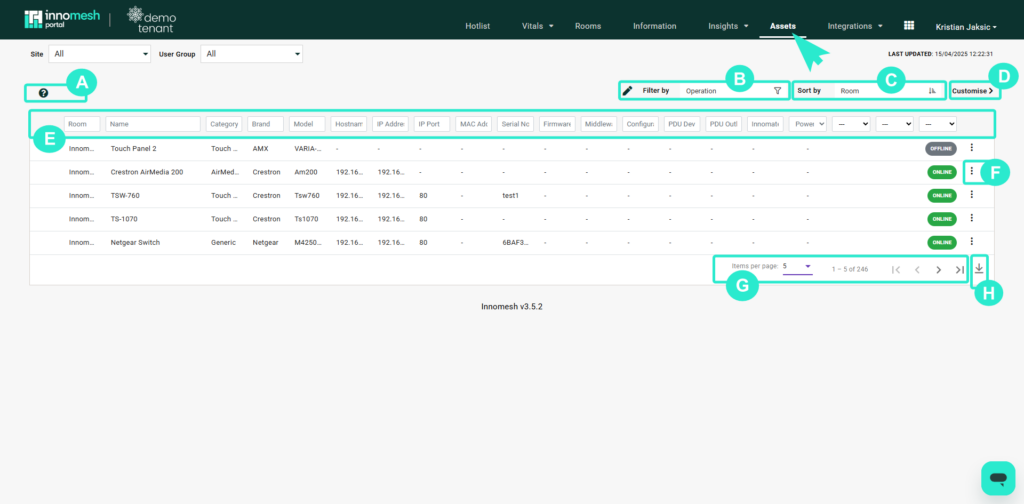
A. Info Icon
Clicking on the question mark icon provides helpful intel and information about the current page and its functionalities. It serves as a quick reference guide to better understand the tools, options, and features available within that section.
B. Filter by actions filter
This filter allows all devices which can be targeted by a specific action to be shown at once. For example, the Update Firmware action filter can be selected, and all devices which are NOT running on the most recent firmware version will then be shown.
C. Sort by filter
The Sort By filter allows a hierarchy of ascending and descending orders to be placed upon the list of devices. This list can be sorted in ascending/descending order of multiple fields at once.
D. Customise
This button allows you to customize which fields are shown on this page.
E. Searchable fields
A room consists of the following fields:
- Room – ‘Friendly Name’ associated with the room, created in Innomesh Room Manager platform.
- Name – ‘Friendly Name’ associated with the device, created in Innomesh Room Manager platform.
- Category – Category of the Device.
- Brand – The make of the device.
- Model – The model of the device.
- Hostname – The device’s hostname.
- IP address – The device’s IP address.
- IP Port – The port in which Innomesh communicates with the device.
- MAC Address – The device’s MAC address.
- Serial No – The serial number of the device.
- Firmware – The Firmware version that the device is currently running on.
- Middleware – The Middleware version in which the device is being controlled with, by Innomesh.
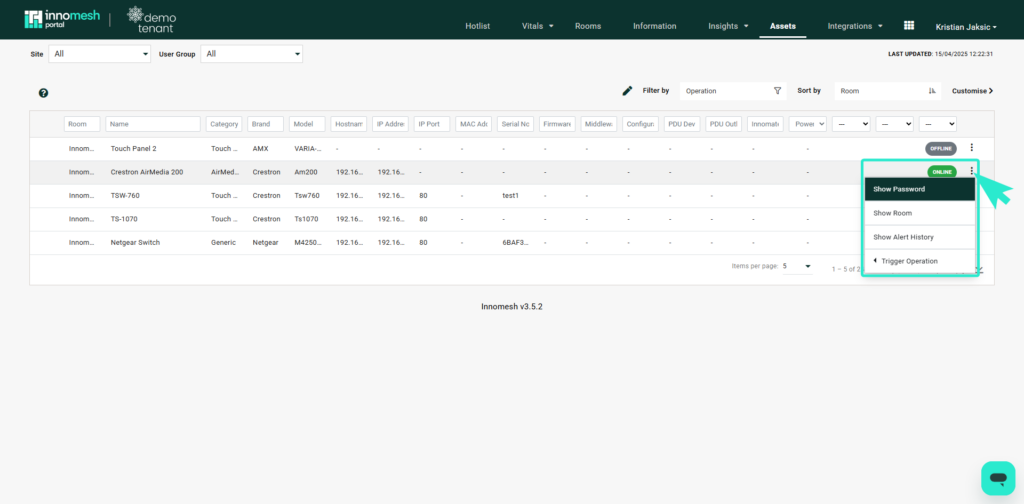
F. Device navigation and controls
The ellipses next to each device allow the user to quickly navigate to the Room details, Room view and Live Info pages.
G. Navigation section
This section allows navigation between the pages of devices. Each page can show between 15 and 100 devices.
H. Download
This button allows the user to download the current list of devices as a CSV file.
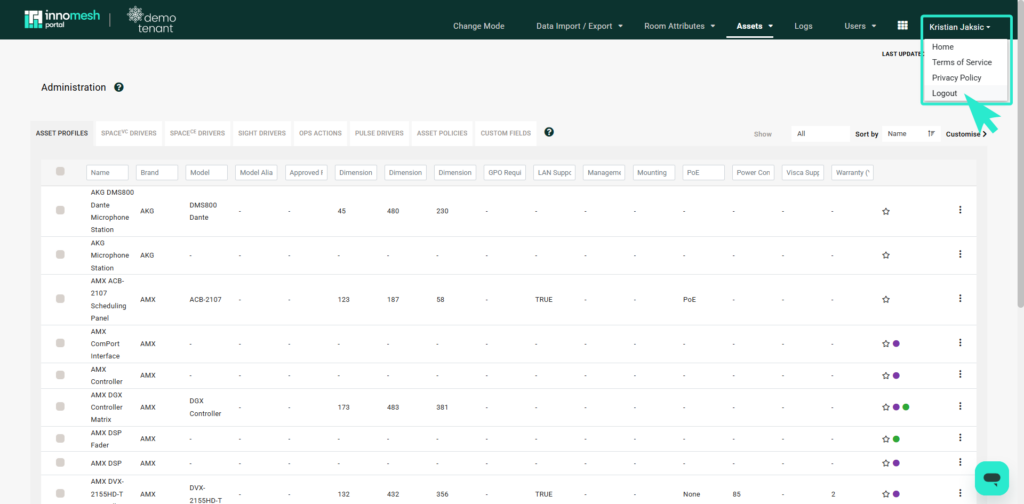
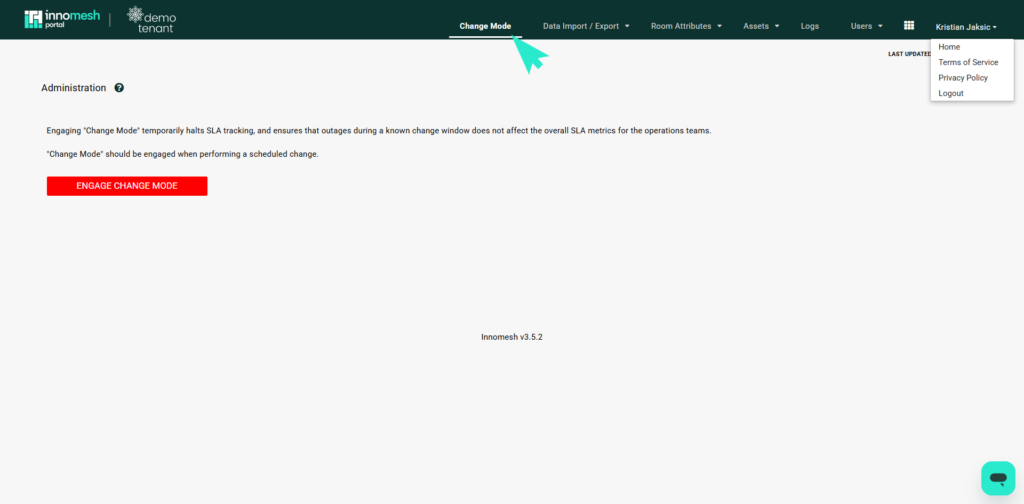
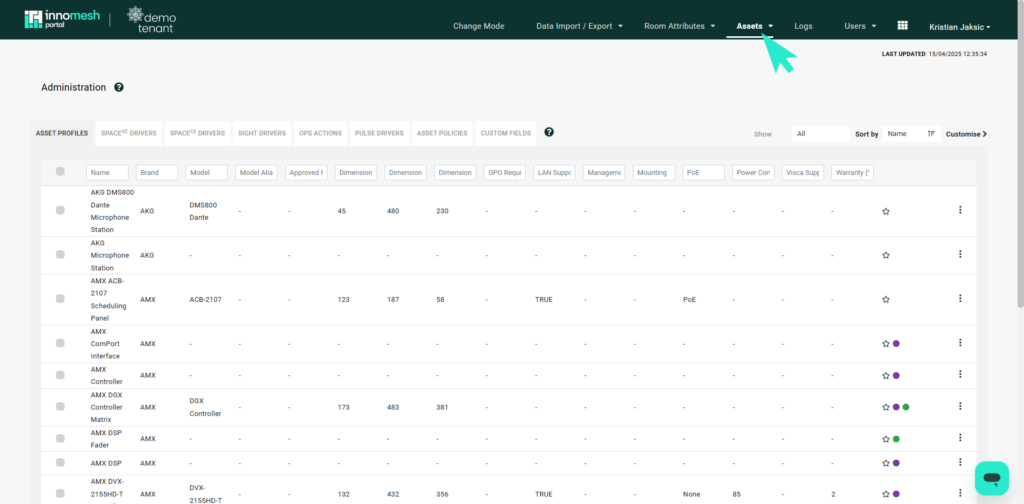
2 Administration
The administration page allows users to ‘Enable Change Mode’ which halts the SLA tracking for the entire environment.
The top navigation bar also allows fields to be added to the ‘Assets’ page. Simply click on the New Field button, and add the title of the field. This field has a boolean value associated with it that will either enable or disable the field’s visibility for users by default.
3 Sign out
Finally, the user can log out of the Innomesh Portal webpage by clicking on this button.