Previously, a significant gap existed across environments with Q-Sys integrations, due to a lack of access to data across the Q-Sys ecosystem. This translated to a number of critical challenges for an AV environment in terms of availability, reporting, functionality, automation and observability constraints. With no notifications for server faults, complex manual troubleshooting processes, no tracking of Q-Sys server metrics, no central alerting, no historical audit trail or event visibility, and no automated configuration management on the Q-Sys servers, AV environments were being restricted and constrained, impacting service quality, and operating costs.
Now, with Innomesh, we’ve plugged that gap! With our rich integration to the Q-Sys ecosystem, the Innomesh platform now provides true Q-Sys Interoperability across your environment, and enables a broad range of powerful functions and features.
In the video below Neil Collins, Innomate’s Director of Growth, interviews Innomate CEO, Paul Yahchouchy, about how this initiative came about, the significant investment in building a feature of this magnitude, and the benefits to Innomesh customers.
Q-Sys Interoperability can be accessed through a new “Integrations” menu within Innomesh Portal, as well as through the Innomesh Portal Assets Registry. The Q-Sys integration feature allows you to view and search all logs, events, insights and files gathered from Q-Sys devices, ensuring that widespread Q-Sys outages can be diagnosed and addressed rapidly.
Let’s take a look at some of the key features unlocked through Innomesh’s exciting new platform feature release: Q-Sys Interoperability
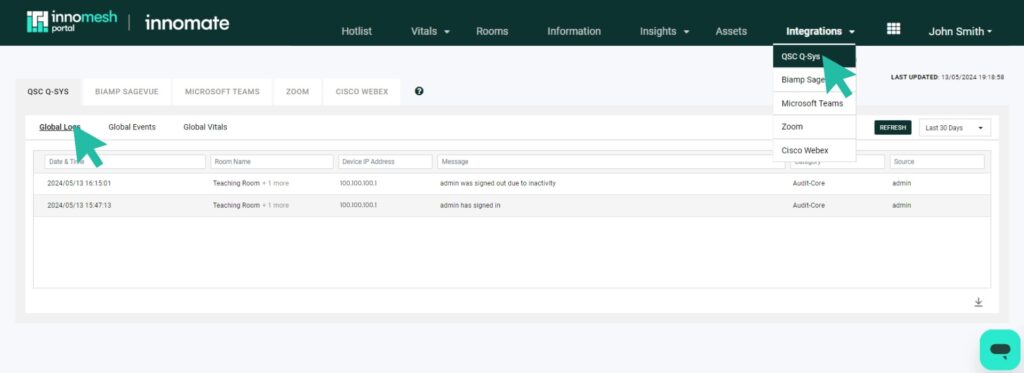
Q-Sys Global Logs
This view shows the results the logs pulled from every Q-Sys core within your AV environment, and allows you to filter and analyse all logs from all devices in one view. You will now have advanced querying and filtering capabilities across Q-Sys logs for your entire environment, enabling much faster troubleshooting. You also now have up to a minimum of three month logging capacity, and a current maximum of 365 days, which enables historical troubleshooting of metrics and events, providing a robust audit trail.
Q-Sys Global Events
This view displays all events that have been detected across all Q-Sys cores across your AV environment. All Q-Sys events will also now trigger a live messaging alert for your support team via your organisation’s live messaging platform, i.e. Slack or Microsoft Teams.
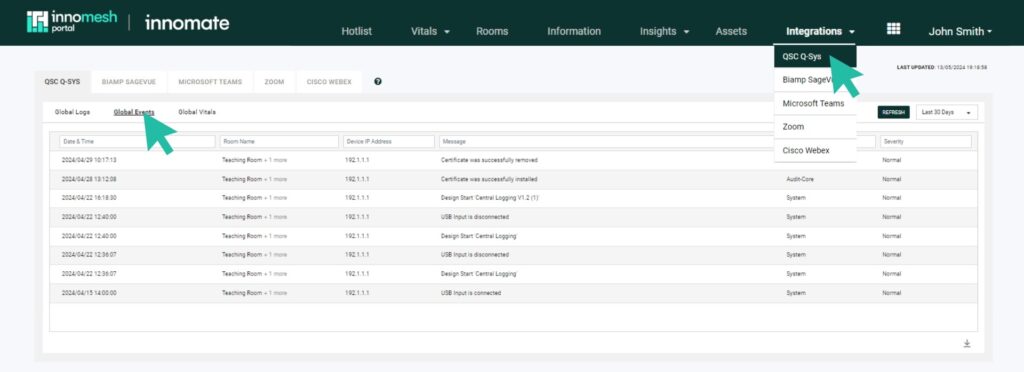
Events that are detected include:
- DSP Design Status – shows the initiation of a system, observable after a firmware update or power reboot. It will be displayed as ‘Design Start [File Name]’.
- Grandmaster Clock Change – indicates any changes in a Q-Sys core’s Grandmaster clock.
- PTPv2 Offset Change – provides updates to changes in the PTPv2 offset.
- USB Connection Status – indicates the connection or disconnection of any USB inputs. These events will be displayed as ‘USB Input is Disconnected’ or ‘USB Input is Connected’.
- Certificate Update – shows any updates to the certificate installed on the device, such as certificate installation or removal. These events will be displayed as ‘Certificate was successfully installed’ or ‘Certificate was successfully removed’.
Q-Sys Notifications (Via Live Messaging)
We have also enabled live messaging notifications for Q-Sys events. Q-Sys events will also be recorded for auditing. Q-Sys events will trigger notifications within your organisation’s integrated messaging platform, i.e.Slack or Microsoft Teams. Your support team will now receive live messaging notifications for the following:
- BMCA Master Clock Changes
- PTPPv1 and PTPv2 Changes
- Q-Sys Server Configuration Changes
- Q-Sys Server Authentication Attempts (failed and successful – for security reasons)
- Q-Sys Server Vital Metrics (CPU, Memory, Temperatures, etc.)
Q-Sys Interoperability also enables automated live analysis, including automated fault detection, which is based on defined data trends, such as PTP and BMCA conflicts. The below example shows a visualisation of data gathered from all Q-Sys devices across your environment.
Q-Sys Global Vitals
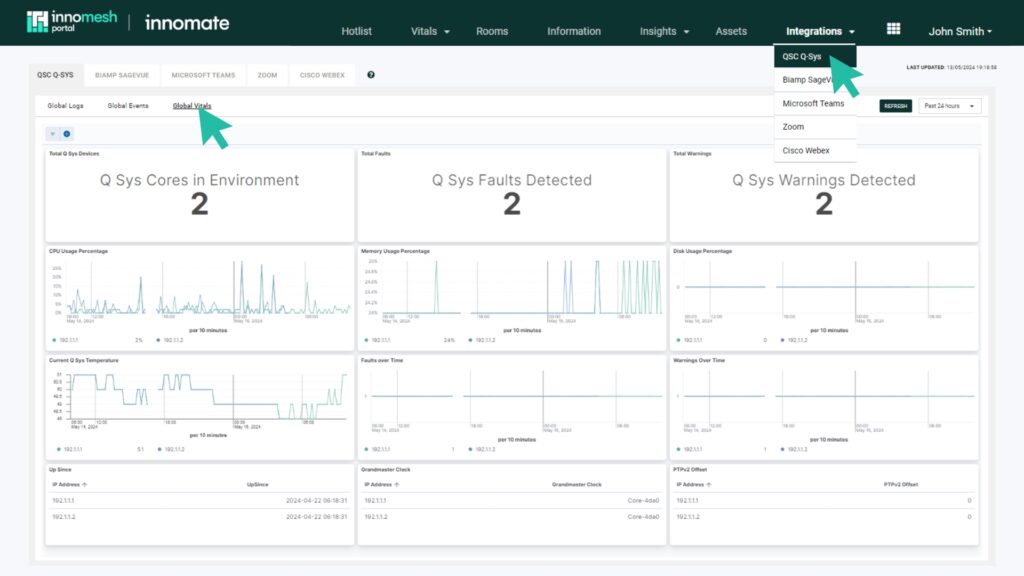
- Total Q-Sys Devices – displays the number of Q-Sys Core units enabled in your environment.
- Total Faults – displays the number of faults per Q-Sys Core unit. These faults will also appear in the Hotlist.
- Total Warnings – displays the number of warnings per Q-Sys Core unit. These warnings will also appear in the Hotlist.
- CPU Usage – shows the CPU usage of the Q-Sys units as a percentage. Abnormal CPU usage will trigger an alert in the Hotlist.
- Memory Usage – shows the memory usage of the Q-Sys units as a percentage. Abnormal memory usage will trigger an alert in the Hotlist.
- Disk Usage – shows the disk usage of the Q-Sys units as a percentage. Abnormal disk usage will trigger an alert in the Hotlist.
- Core Temperature – shows the temperature of the Q-Sys units in Celsius. High temperatures will trigger an alert in the Hotlist.
- Up Since – indicates the uptime of the Q-Sys units since the last power-off or network drop.
- Grandmaster Clock – displays the grandmaster clock for each Q-Sys device.
- PTPv2 Offset – shows the offset for each Q-Sys device.
Q-Sys Centric Alerts in Hotlist
You will now see all Q-Sys centric alerts related to Q-Sys cores and their peripherals included in the Hotlist.
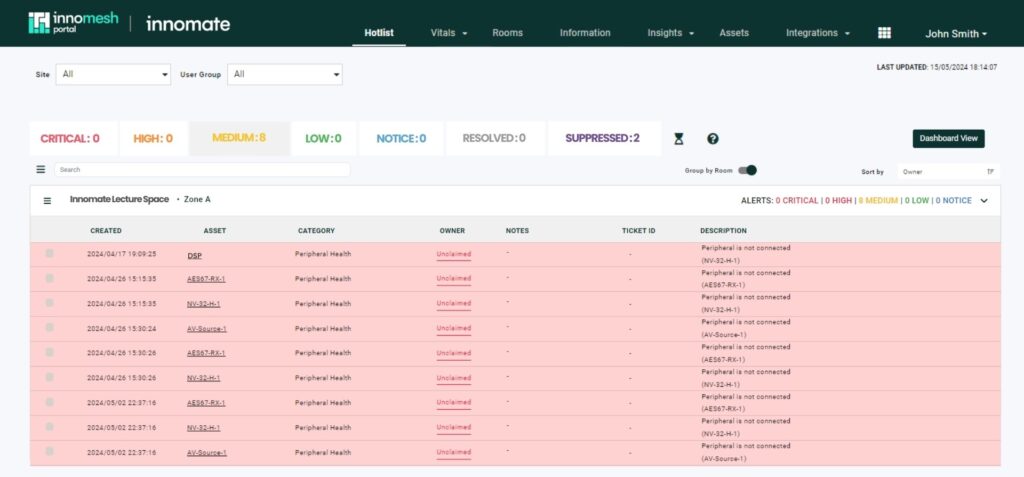
The Q-Sys centric alerts that are now included in the Hotlist are listed below:
- Peripheral health
- Grandmaster clock faults
- Core overheating
- High CPU usage
- High memory usage
- High storage usage
Q-Sys Core Ops
This feature allows you to trigger Ops actions specific to Q-Sys from the Innomesh Portal Assets Registry, just as you are used to doing for all other Ops actions.
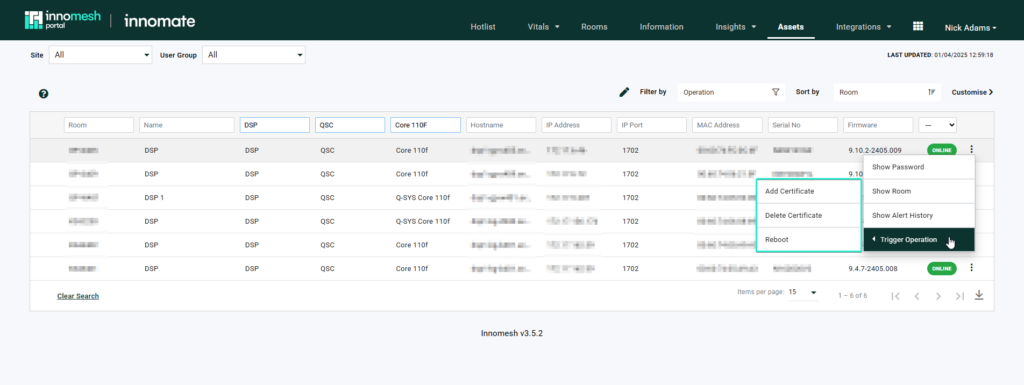
This means you now have the following additional Ops actions, specific to Q-Sys:
- The ability to reboot
- The ability to upload or delete certificates
Q-Sys Peripherals
Q-Sys peripherals, gathered using Q-Sys device information, are now included as part of the Innomesh Portal Asset Registry. This means that assets that were previously unmonitored as they were only connected to the DSP can now be monitored directly through Innomesh
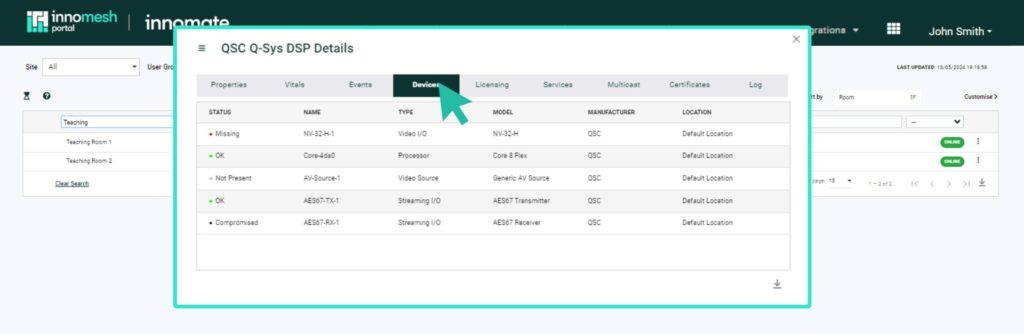
Q-Sys Asset Information
Opening a Q-SYS core in the Asset Information View will present an extra tab that most other assets in this view will not have. This is the Integrations tab and for Q-SYS devices it will show plenty of extra useful information. This is in addition to another place to access the Ops described above.
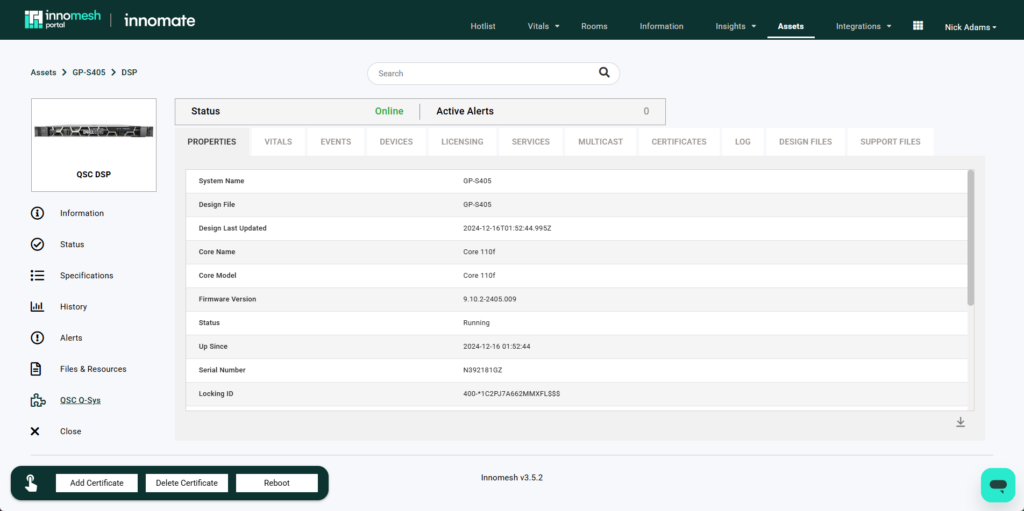
The pages available are as follows:
- Properties – A list of Information collected from the DSP that is specific to QSYS DSP’s.
- Vitals – A similar page to global vitals, but for the individual DSP selected.
- Events – Events that have occurred at the device level.
- Devices – A list of devices that are connected to this Q-SYS Core. These devices will also appear in the assets list.
- Licensing – A list of Licenses that are applied to this DSP that includes the license type and the license expiry date.
- Services – The network services that are running on the Q-SYS core and what network port they are active on.
- Multicast – Information about the multicast ranges that the Q-SYS core is using
- Certificates – A list of the certificates loaded on the device.
- Log – A detailed log from the Q-SYS Core
- Design Files – An archive of the design files, see here for more information
- Support Files – An archive of the support files, see here for more information
Automated Configuration Management
Through Q-Sys Interoperability in Innomesh, your Q-Sys server configurations will now be regularly archived and versioned into a repository, without human intervention.
Accessed through the Asset Information Page > QSC Q-Sys > Design Files/Support Files, users will see a list of the archived Q-Sys design files and support files. If the design file has been majorly changed and needs to be reverted to a previous state, then the user can download an older version of the design file and upload it to the core to restore it to that version.
The support files can also be downloaded for ease of access without having to download them from the Q-Sys core while troubleshooting directly.
